How to Audit Your Martech Stack (and Cut the Idle Spend)
Most martech audits fail because they only count licence fees — which is usually less than half of what a tool really costs once you add integration upkeep, manual data-bridging labour, admin time, and switching drag. The real fix is to measure actual utilisation instead of seats purchased, calculate the true annual cost per tool, and sort everything into Keep, Train, Consolidate or Cut. Run it properly and a first audit usually frees up budget within one renewal cycle.
A martech stack audit is a structured review of every marketing tool you pay for, measuring what each one actually costs, how much it is genuinely used, and whether it can be tied to pipeline. The output is a decision for each tool: keep it, drive adoption, fold it into something you already own, or cancel it. Done properly, a first audit usually frees budget within one renewal cycle.
Most audits fail for a boring reason, though. They count licence fees.
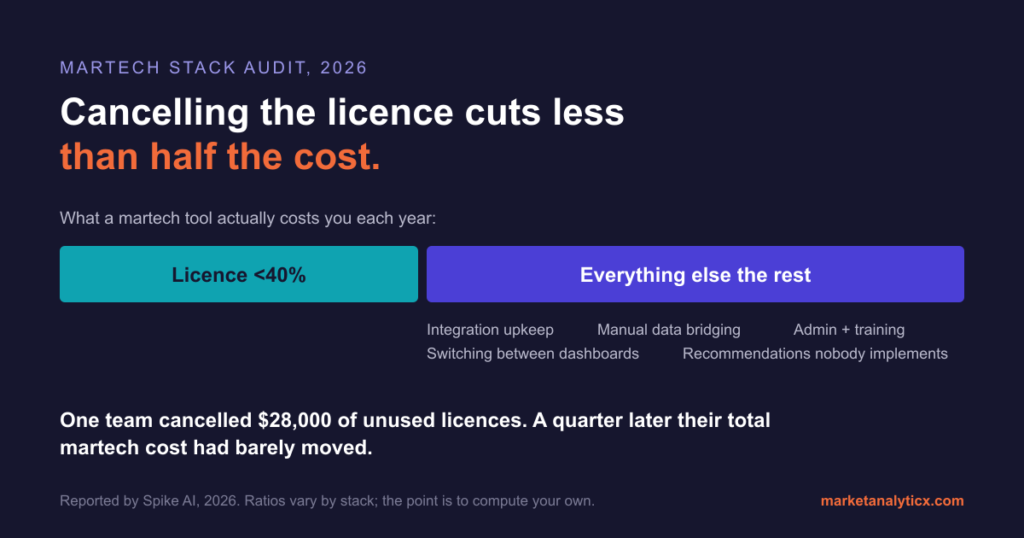
One marketing team cancelled three unused tools, banked $28,000 in annual licence savings, and declared the job done. A quarter later their total martech costs had barely moved, because those licence fees came to less than 40% of what the tools were really costing them, as Spike AI reported in 2026. The rest sat in integration maintenance, manual data reconciliation between systems, admin time, and the drag of switching between dashboards nobody had bandwidth to act on. Cancel the subscription and all of that stays exactly where it was.
So this guide covers both halves: how to find the idle spend, and how to count what a tool actually costs before you decide its fate.
Why now: the money is already in the stack
Gartner’s 2025 Marketing Technology Survey found marketing teams actively use just 49% of the tools in their stack, and closer to a third of the capability they have purchased. Only about 15% of organisations qualify as martech high performers. Meanwhile marketing budgets have stayed flat at roughly 7.7% of company revenue, with martech taking around a fifth of that, and 59% of CMOs report they lack the budget to execute their strategy.
Put those together and one conclusion follows: for most teams, the next chunk of marketing budget is not going to be granted. It is already being spent on tools nobody opens.
There is also evidence that cutting helps rather than hurts. Forrester’s 2025 B2B benchmark found companies running five or fewer core tools reported 23% higher marketing-attributed pipeline per headcount than those running ten or more. In one case documented by Heinz Marketing, a B2B firm went from 28 tools to 7 through a utilisation-first audit and reported a 31% pipeline increase, which they attributed to finally having unified reporting. That is a single case rather than a benchmark, but it points the same direction as the Forrester data: leaner stacks, better connected, outperform sprawling ones.
Step 1: Inventory everything, including the things nobody admits to
Start with a complete list. Not the list in the procurement system, the real one.
For each tool, capture the name, the owner, annual cost, renewal date, number of licensed seats, and what it integrates with. Then go hunting for the entries that never make it onto the official list: free tiers that became load-bearing when nobody was looking, personal subscriptions expensed by individuals, tools inherited from a departed employee, and anything a contractor set up and left running.
The renewal date column matters more than people expect. It sets your calendar for the rest of this exercise, because a cut you identify two weeks after auto-renewal costs you a full year.
Expect the list to be longer than you think. Estimates of average stack size vary by market and company size, commonly landing anywhere from 40 to 90-plus tools in mid-market and enterprise organisations, drawn from a market that now lists more than 15,000 products.
Step 2: Measure real utilisation, not licences purchased
This is the step that separates a real audit from a spreadsheet exercise. Do not ask people whether they use a tool; nobody wants to admit their request from last year is now shelfware.
Pull the evidence instead:
- Login data. How many of the licensed seats logged in during the last 90 days?
- API call volumes. Is data actually moving through this tool, or is it connected on paper?
- Feature usage. Which of the modules you are paying for are switched on? This is where the gap between “we use it” and “we use a third of it” appears.
- Output. How many campaigns, reports, or workflows have actually shipped from this tool this quarter?
Two numbers matter per tool: the share of purchased seats being used, and the share of purchased capability being used. Both feed the cost calculation in step 4, and both tend to come in lower than anyone predicts.
Step 3: Map the integrations and find the manual bridges
Now draw how data moves between the tools, because this is where cost accumulates out of sight. Data integration is the single most-cited stack management challenge, named by roughly two-thirds of organisations.
Look for three things. First, tools holding data that never leaves them, since an isolated tool cannot contribute to a unified picture no matter how good it is. Second, contradictions, where the CRM and the automation platform disagree about the same prospect, which is a sign that something in between is broken. Third, and most valuable, the manual bridges: the weekly CSV export, the copy-paste between dashboards, the recurring meeting whose real purpose is reconciling two numbers that should match.
Those manual bridges are expensive. In one example Spike AI documented, a RevOps manager was spending six hours a week manually syncing lead scoring data between Salesforce and a marketing automation platform. Replacing that with an automated workflow costing around $50 a month reclaimed over 300 hours a year of senior time.
Every manual bridge you find is a person doing an integration’s job. Write each one down with an estimate of hours per week, because you are about to price them.
Step 4: Calculate what each tool actually costs
Here is the formula the licence-only audits miss. For each tool:
True annual cost = licence + integration upkeep + manual bridging labour + admin and training + switching drag
Taking each in turn:
- Licence. The invoice. The easy part, and often the smaller part.
- Integration upkeep. Engineering or ops hours spent maintaining connectors, fixing syncs, and repairing things after vendor updates.
- Manual bridging labour. The hours from step 3, priced at a loaded hourly rate. Six hours a week of a senior ops person is not a rounding error; at a loaded rate of $60 an hour it is roughly $18,700 a year, and you should substitute your own rate rather than borrowing that one.
- Admin and training. Onboarding, permissions, vendor management, and the time to bring new hires up to speed.
- Switching drag. Harder to price precisely, but real: the cost of a team working across eight dashboards instead of two, and of insights that arrive too late to act on.
Then the number that drives decisions:
Idle spend = true annual cost × (1 − actual utilisation)
A $12,000 tool with $8,000 of surrounding costs and 30% utilisation is not costing you $12,000. It is costing you $20,000, of which around $14,000 is buying nothing. Run that calculation across the stack and the audit stops being an opinion. It becomes a number you can take to finance.
One caution on the ratio: the “under 40%” figure above comes from one team’s experience, not a universal law. Different stacks distribute cost differently. Whatever the split is in your stack, compute it rather than assuming the invoice is the answer.
Step 5: Decide, using two questions
With utilisation and true cost in hand, each tool sorts on two axes: is it actually used, and can it be tied to pipeline?
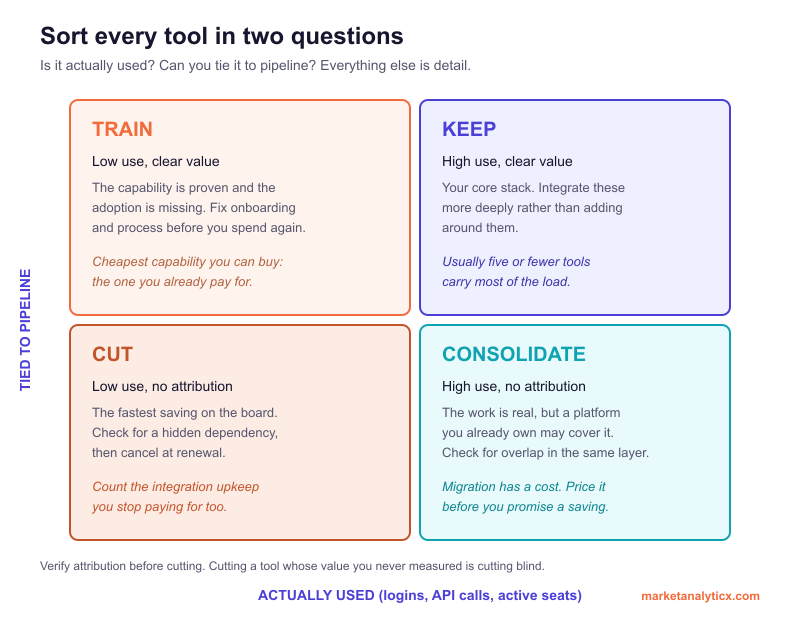
Keep is high use with clear value. This is your core stack, usually five or fewer tools carrying most of the load. Integrate these more deeply rather than buying around them.
Train is low use with clear value. The capability is proven and the adoption is missing, which is an onboarding and process problem, not a purchasing one. This quadrant is where the cheapest capability available to you lives: the tool you already pay for.
Consolidate is high use with no attribution. The work is real, but a platform you already own may absorb it. Look for overlap within the same layer of the stack, since two tools doing orchestration on the same channels is integration debt you pay for monthly. Price the migration honestly before promising a saving.
Cut is low use with no attribution. The fastest saving on the board. Check for hidden dependencies, then cancel at the renewal date you logged in step 1, and remember to count the integration upkeep you stop paying for as well as the licence.
One rule governs the whole matrix: verify attribution before cutting. A tool whose value you never measured is not the same as a tool with no value, and cutting blind is how audits lose the trust of the team next time round.
Step 6: Sequence the changes, then stop it happening again
Group your decisions into three horizons so the plan survives contact with a working quarter.
Immediate wins, zero to thirty days, are the clean cuts: unused tools with no dependencies, approaching renewal. Practitioners running these audits report that a first pass typically identifies three to five tools that can go straight away, which for UK SME teams has meant somewhere in the range of £15,000 to £40,000 a year before any deeper restructuring.
Medium-term consolidation, three to six months, covers the tools whose work needs to move somewhere else first. Sequence these around renewal dates and campaign calendars, not around enthusiasm.
Strategic replacement, six to twelve months, is for core platform decisions that need a business case and a migration plan.
Then close the loop, because stacks re-bloat by default. The practices that keep them lean are dull and they work: one owner per tool, a standing rule of one tool per function, a quarterly review with marketing, sales and ops in the room, and a requirement that any new purchase names the tool it replaces. Utilisation should be a metric you look at every quarter, not a thing you discover during a budget crisis.
This is the diagnosis half of what we do at Market Analyticx through the Signal Method: map the stack, connect the data, and turn what you find into a ranked list of decisions tied to pipeline. If you would rather have that run for you than run it yourself, the Signal Audit is exactly this exercise, delivered as a decision list rather than a spreadsheet.
Five mistakes that ruin an audit
Counting licences only. Covered above, and the most expensive mistake on the list.
Cutting before you can attribute. If your measurement is weak, fix attribution first or you will cut the wrong things and prove the sceptics right.
Auditing inventory instead of usage. A list of tools tells you what you bought. Login and API data tell you what you own.
Ignoring migration cost. Consolidation savings that ignore the cost of moving data, rebuilding workflows and retraining people are not savings, they are a forecast that will miss.
Treating it as a one-off. Utilisation has drifted downward across successive Gartner surveys for years. A stack audited once and never governed will look the same again within eighteen months.
FAQ
Bottom line
Cancelling software is the smallest part of this. The work is finding out what you already own, what it truly costs and what it returns, then making a decision on each item instead of paying by default.
Two habits separate an audit that saves money from one that just produces a document. Count the full cost of a tool rather than its invoice, and verify attribution before you cut. Get those right and the first pass usually pays for itself inside a renewal cycle, and the stack that remains is the one your team can actually run.
The one-page audit checklist
- Every tool listed, including free tiers, personal subscriptions and inherited accounts
- Renewal dates logged and mapped to a calendar
- Login, API and feature-usage data pulled for each tool (not self-reported)
- Integration map drawn, with every manual bridge and its weekly hours written down
- True annual cost calculated per tool: licence plus upkeep, bridging labour, admin, switching drag
- Idle spend calculated: true cost times one minus utilisation
- Every tool sorted into Keep, Train, Consolidate or Cut
- Attribution verified for anything you plan to cut
- Migration costs priced for anything you plan to consolidate
- Actions grouped into 0-30 day, 3-6 month and 6-12 month horizons
- Governance set: one owner per tool, one tool per function, quarterly utilisation review

Ajendra Singh Thakur is the founder of Market Analyticx, an AI marketing operations consultancy for B2B SaaS, fintech, and developer-tools companies. He specialises in Generative Engine Optimization (GEO) and Answer Engine Optimization (AEO), helping brands earn citations in ChatGPT, Perplexity, Claude, and Google AI Overviews. He brings 12+ years across SEO, growth, and marketing operations, and is based in Berlin.